



Data can be filtered by date, department, or user, allowing for precise and customized comparisons.
The panel displays visual and percentage indicators that show how work time is being used, making it easier to identify behavioral patterns and improvement opportunities.
In addition to productivity metrics, you can also observe performance trends over time, identifying whether the team is improving or showing a drop in results during certain periods.
💡 Tip: Use the Productivity Dashboard to support management decisions, identify operational bottlenecks, and recognize employees who make the best use of their time.
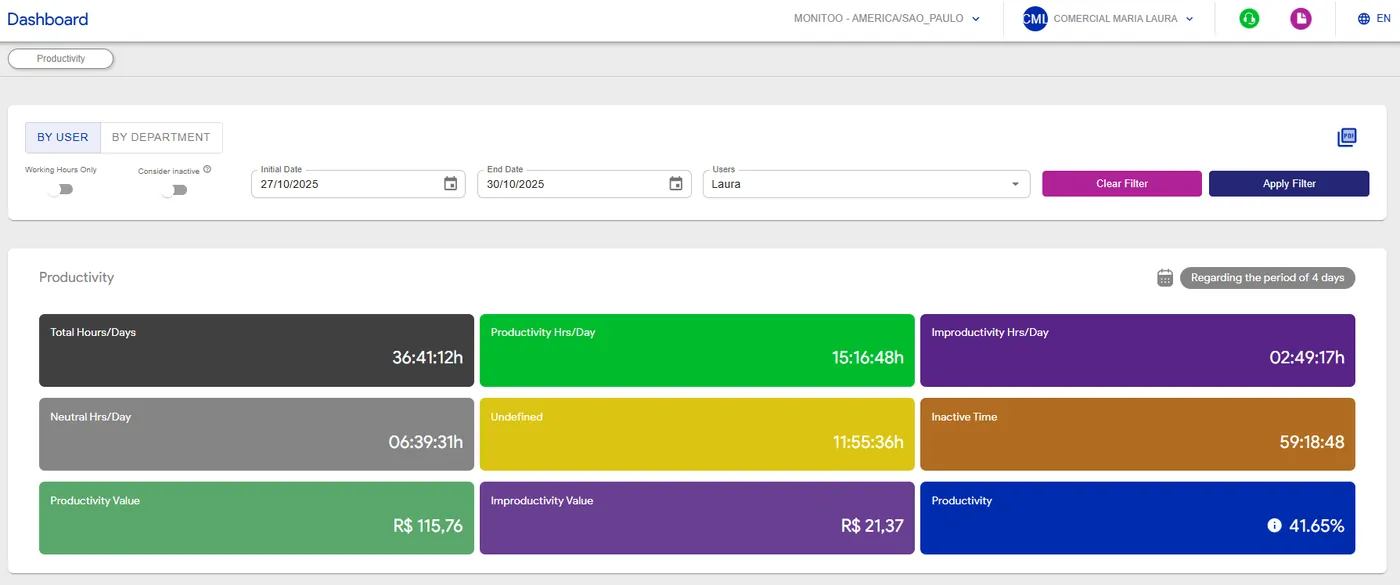
To register employee salary information, follow the steps below:
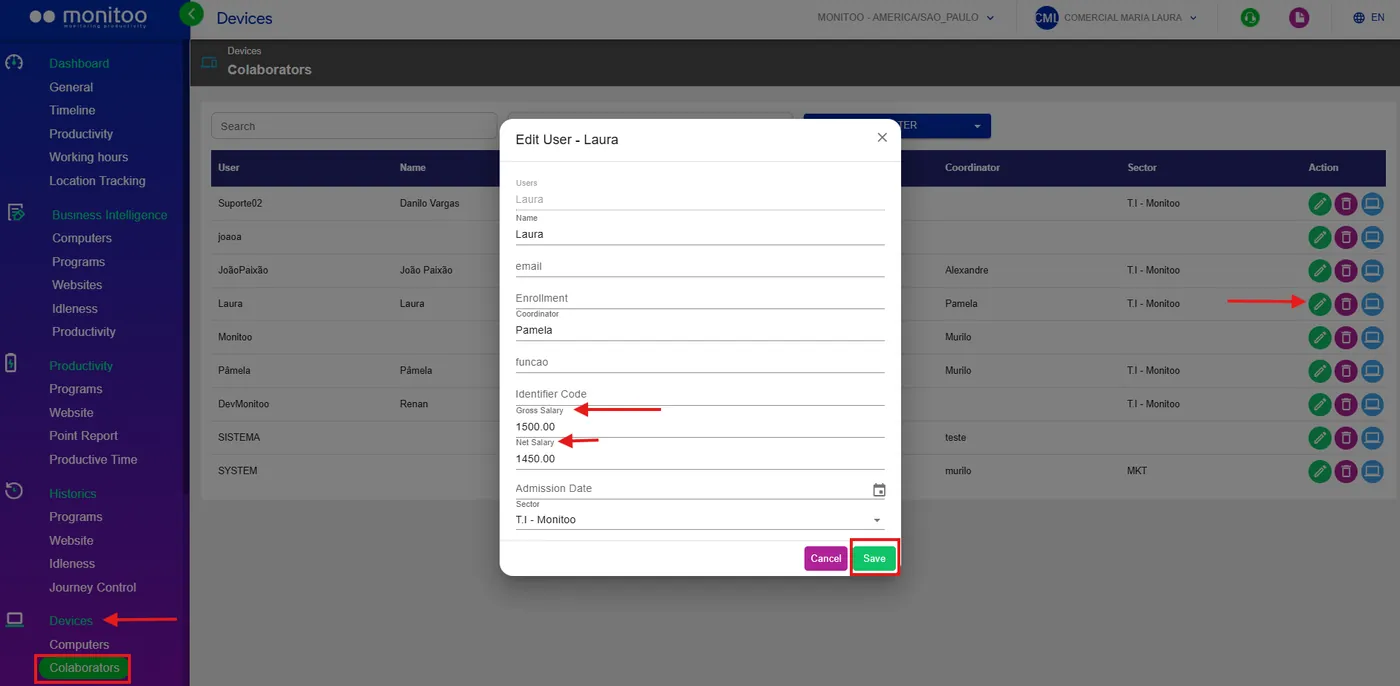
Go to: Devices > Employees. In this section, you can record each employee’s gross and/or net salary individually.
 Go to: My Data.
Here, you can enter an estimate of the number of days worked per month for each employee.

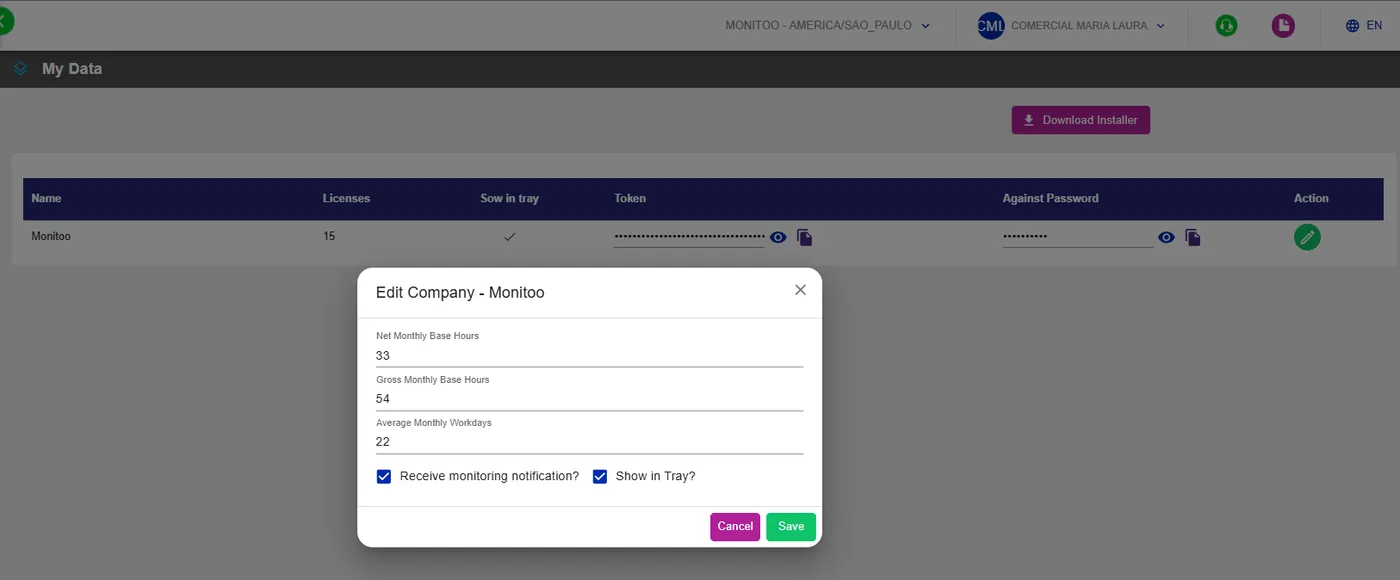 With this information filled in, the system automatically calculates the value of productivity and value of unproductivity, allowing for a more accurate financial analysis of the return on time invested by each team member.
💡 Tip: Keep salary values and worked days always up to date to ensure that productivity calculations accurately reflect the reality of your operation.
See how:
Great! Thanks for your feedback.
Tell our team what was missing: contact support on WhatsApp.
